
The Ribbon tool visualizes student progression through time or milestones, nesting data to highlight different characteristics. It allows users to select and visualize the paths of specific subgroups. Access requires campus authentication with pre-made or user-created Excel files.
What can you do with the tool?
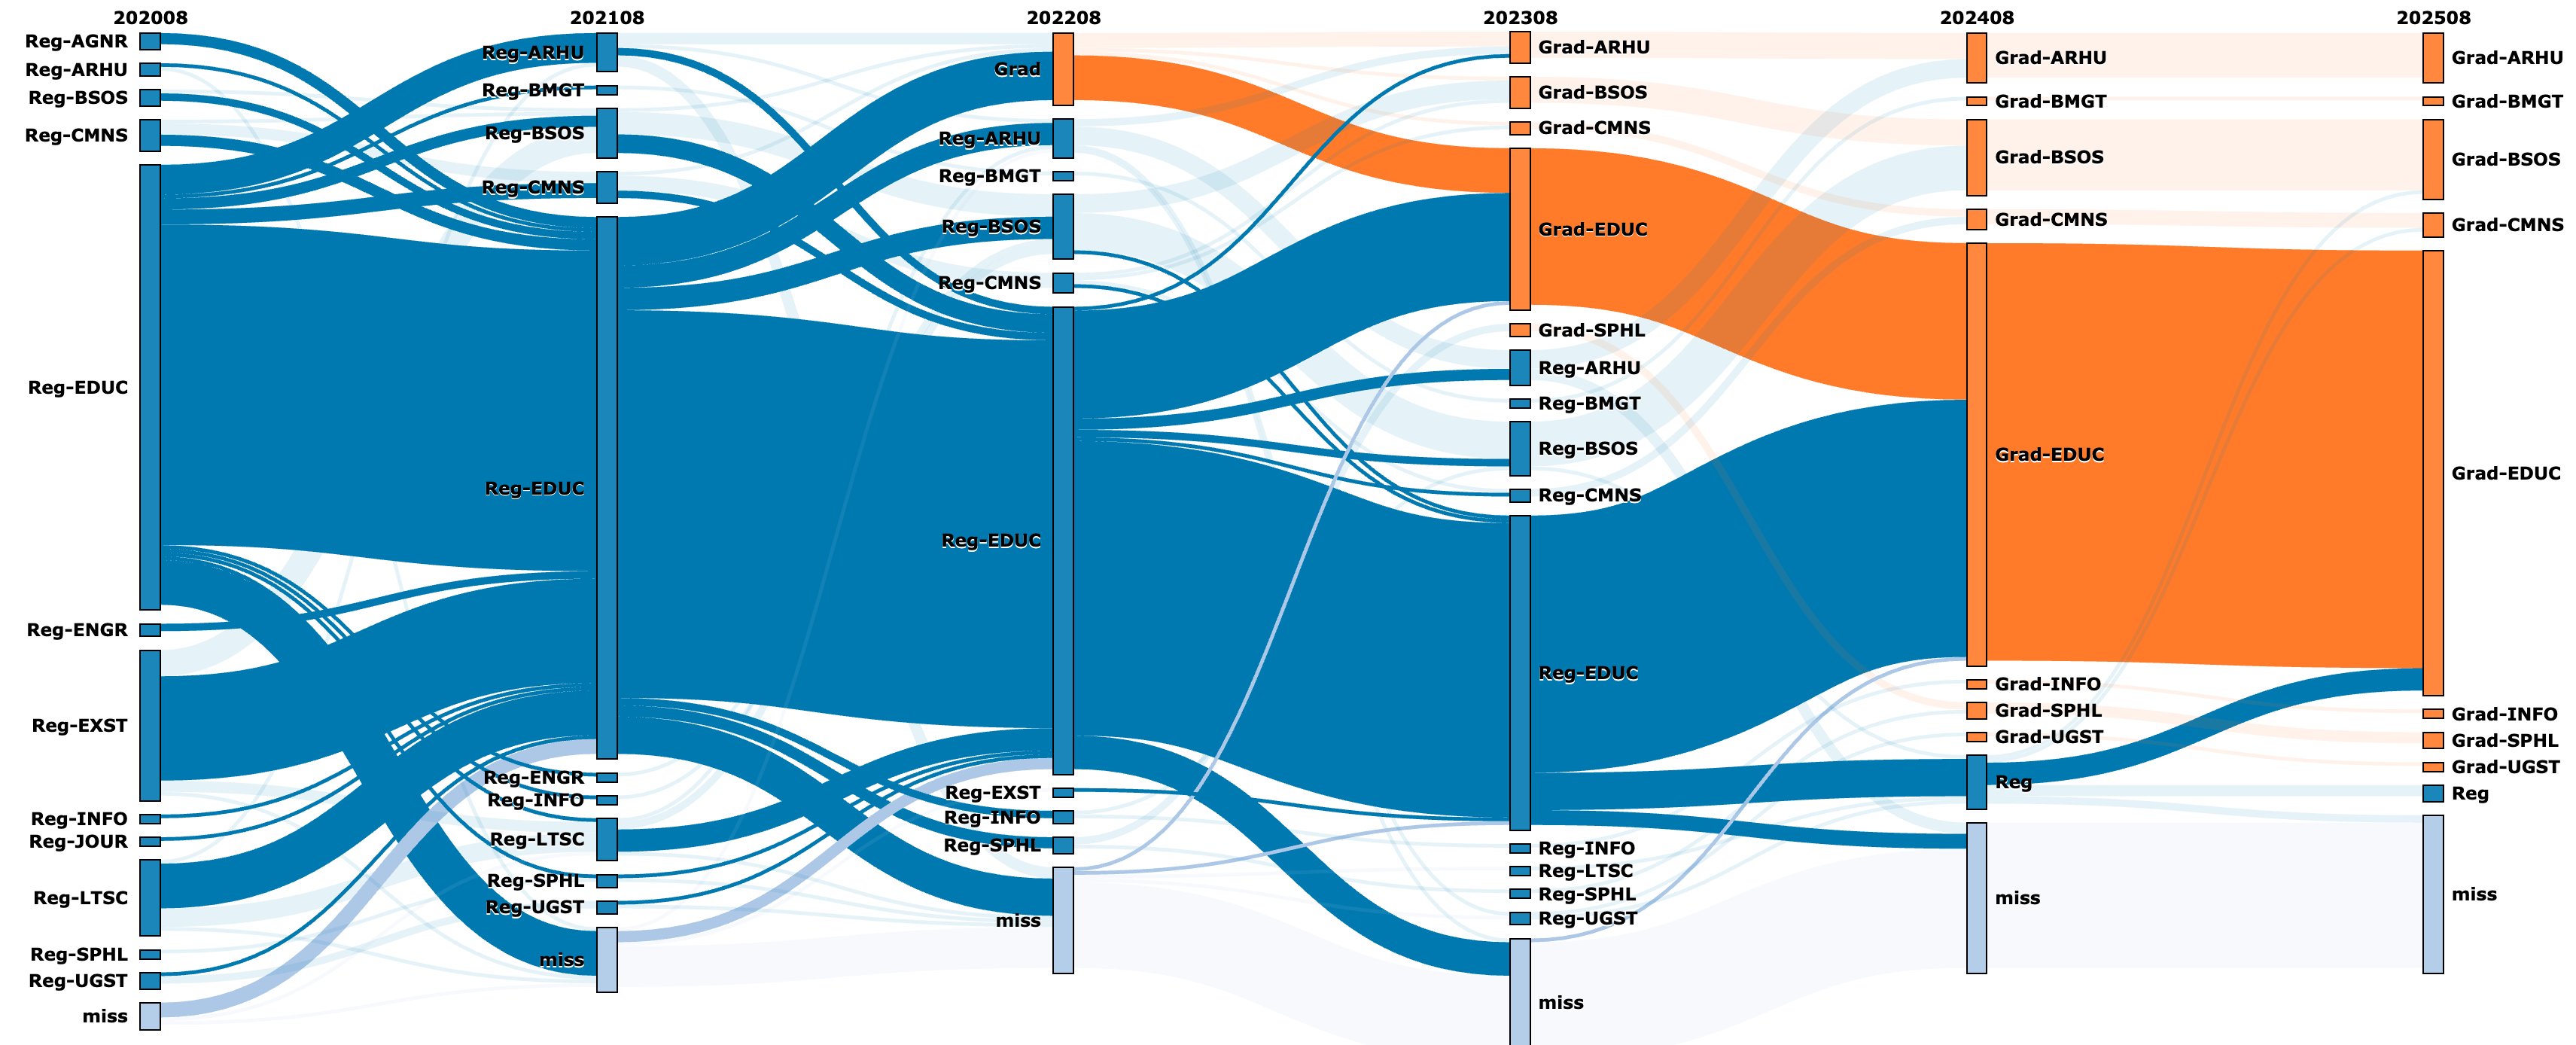
- Visualize student movement between majors, including entry, exit, graduation, or leaving the university.
- Filter data by demographics, entry level, or starting major to observe differences.
- Visualize student paths through course sequences or milestones based on outcomes (e.g., grade) to identify bottlenecks.
- Visualize any characteristic-based data following subjects through time or milestones.
Current/Potential Outcomes
- Improved understanding of major transitions (acceptor/donor majors and timing).
- Better understanding of student flows through early math courses (Foundational Math Initiative).
- Visualization of student flows through courses based on outcomes.
- Confirmation of engineering student paths into computer science.
- Development of targeted questions for deeper investigation using broader campus data.
Users
- Department and College leaders (Deans, DUGs, chairs, advisors) investigating major/college student flow.
- Campus committees tackling specific course sequence improvements.
- Faculty/course coordinators working on course improvement.
- Special projects (e.g., Terrapin Teachers program).
- Groups developing new academic programs.